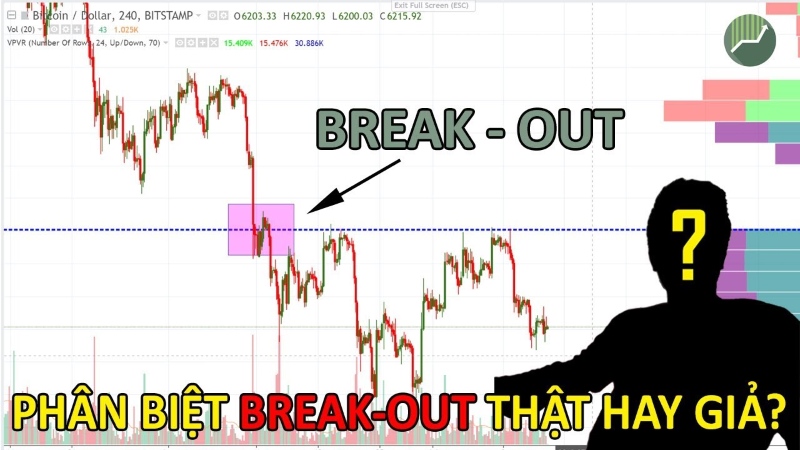
What is Break out? This is an important term in stocks, describing a price breakout through an important threshold, opening up great investment opportunities for traders.
1. What is Break Out?
In finance and securities, the term breakout is often used to refer to a phenomenon where a price breaks through an important price level. These price levels, also known as resistance or support levels, play an important role in determining the price trend of a financial asset, such as a stock or index.

Once the price breaks through this level with a significant increase in trading volume, it often signals the beginning of a new trend. Investors should pay attention, especially when the market is highly volatile, because the breakout can provide important signals for making timely and accurate trading decisions.
2. What is Break Out in Stocks?
A breakout in stocks mainly represents a break out of a stock price from previously maintained price zones. These price zones are usually determined by two important levels:
- Resistance threshold: Price zone where selling pressure increases strongly, preventing prices from continuing to rise.
- Support level: The price zone where strong buying pressure prevents the price from falling further.
When a stock price breaks above these levels with the support of high trading volume, this usually signals that one side – either the buyers or the sellers – has gained the upper hand, leading to a new price trend.
Real life example: Suppose a stock has been trading in the range of 50,000 – 55,000 VND for a long time. If the price breaks the 55,000 VND threshold with a large trading volume, this is a sign of a breakout.
3. The Importance of Break Out
The breakout phenomenon is not just a price event, but it also plays a strategic role in technical analysis. So What does break out mean?
3.1. Forecasting New Trends
Breakouts can be considered as indicators of a change in market trend. This can help investors identify opportunities to participate in a new trend at an early stage.
3.2. Open Up Trading Opportunities
A spike in trading volume during a breakout session is often a signal that large amounts of money are pouring into the market. This is an opportunity for investors to take advantage of the strong volatility and make a profit.
3.3. Measuring Market Sentiment
Breakouts are not only technical phenomena but also reflect the general sentiment of investors. When prices break through resistance levels, it shows optimism and expectations for price increases. Conversely, if prices break through support levels, market sentiment often becomes pessimistic.
4. What is a Break Out Stock?
Breakout stocks are stocks whose prices break through an important price level after a period of consolidation. This usually signals strong upside potential, especially when supported by significant volume.

Illustrative example: A stock fluctuates between VND 30,000 and VND 35,000 for several weeks. If the price breaks above VND 35,000 with a larger than normal trading volume, this is a breakout stock.
While these stocks are often attractive to investors, it is important to note that not all breakouts lead to sustained growth. It is important to incorporate other analytical tools such as technical indicators or market trends.
5. What is a Break Session?
The concept of a breakout session refers to a trading session in which the price of an asset or market index breaks through important resistance or support levels. This is considered a strong sign of the beginning of a new period of volatility.
Real life example: In a trading session, if VN-Index breaks the resistance level of 1,300 points, this shows that the market may enter a new growth phase with high potential.
6. What is a False Break Out?
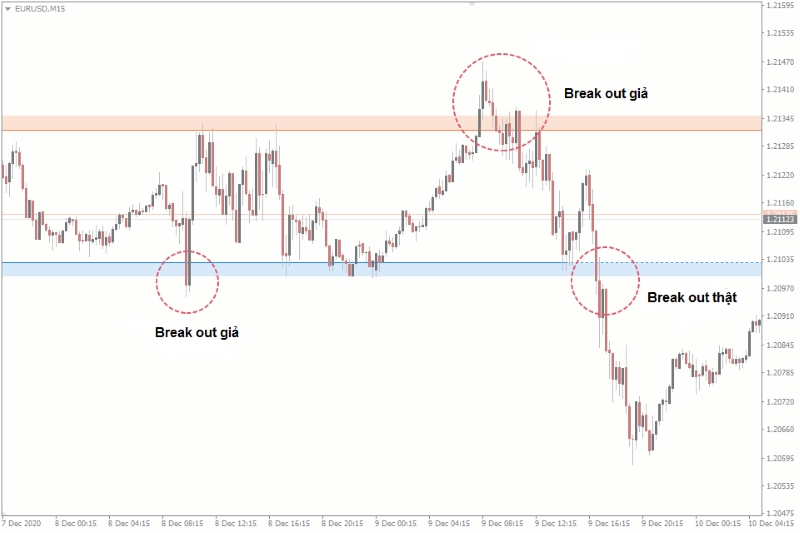
A false breakout is a phenomenon where the price breaks through a resistance or support level but fails to maintain the new trend and quickly returns to the old price zone. This is a common trap that causes many investors to make wrong decisions.
6.1. Low Volume Signals
A false breakout is usually not accompanied by a noticeable increase in trading volume. This indicates a lack of consensus from big money.
For example: If the average trading volume is 1 million units per session, but the breakout session only reaches 800,000 units, this is a signal to be cautious.
6.2. Price Returns to Old Level
A false breakout is usually accompanied by a price failure to stay above a resistance level (or below a support level) and quickly returning to its original price level.
For example: The stock price crossed the 100,000 VND mark and rose to 105,000 VND, but then fell sharply below 100,000 VND.
6.3. Reversal Signal Appears
Technical signals such as reversal candlestick patterns (Doji, Shooting Star) or divergence from indicators such as RSI, MACD also often appear in false breakouts, signaling the possibility of an unsustainable trend.
Illustrative example: After the price breaks the resistance level, a strong bearish candle or divergence signal appears, indicating a high possibility of a reversal.
7. Distinguishing Real and Fake Break Outs: Useful Support Tools
Identifying real and fake breakouts is a challenge that many investors face. To improve the ability to differentiate and limit the risk of false signals, the following technical analysis tools can play an important role.

7.1. RSI (Relative Strength Index) Indicator
RSI is a tool that measures the strength and sustainability of price trends.
- When the price breaks important levels and the RSI goes above 70 (indicating an overbought market) or falls below 30 (indicating an oversold market), there is a high probability that this is a signal of a real breakout.
- Conversely, if RSI does not change significantly, investors need to be cautious of the possibility of a false breakout.
7.2. MACD (Moving Average Convergence Divergence) Indicator
The MACD indicator helps identify trend changes through the correlation between moving averages.
- A real breakout signal can be confirmed when the MACD line crosses above the signal line and the histogram increases significantly.
- In case the MACD shows no signs of volatility, the breakout signal is likely to be unreliable.
7.3. Bollinger Bands
Bollinger Bands are a commonly used tool to gauge price volatility.
- If the price breaks above the upper or lower band of the Bollinger Bands accompanied by a sharp increase in trading volume, this could be a sign of a real breakout.
- However, when price quickly returns inside the Bollinger Bands, this phenomenon is often associated with a false breakout.
8. What Are Common Mistakes When Trading Break Out?
When trading based on the breakout phenomenon, investors often make some common mistakes. To avoid unnecessary risks, pay special attention to the following points:
8.1. No Waiting for Signal Confirmation
A big mistake is to enter an order too early when the price has just broken through a resistance or support level without clear confirmation from trading volume or other indicators.
8.2. Ignoring Volume Factors
Trading volume is an important factor in assessing the reliability of a breakout. If you do not closely monitor volume, investors can easily fall into the trap of false signals.
8.3. Do not set Stop Loss
Failure to set a stop loss leaves the investor vulnerable to heavy losses when the breakout signal is not maintained. Stop loss is an indispensable step in effective risk management.
9. Notes When Trading According to Break Out
To trade breakouts successfully, investors need to implement specific strategies and adhere to risk management principles:
- Confirmation by trading volume: A breakout is only truly reliable when accompanied by a significant increase in trading volume, which reflects strong participation from large money flows.
- Wait for stable signal: Don't rush into trading as soon as the price breaks an important level. Instead, wait patiently for the price to stay above the resistance level or below the support level for several consecutive trading sessions.
- Smart risk management: Always set reasonable stop losses to minimize losses in case the breakout signal is not confirmed.
10. What is the Importance of Break Out in Stocks?
Breakout is an important concept in stock trading, providing an opportunity to identify new trends and optimize profits. However, to effectively use this phenomenon, investors need to:
- Combine multiple technical analysis tools like RSI, MACD and Bollinger Bands to confirm signals.
- Pay attention to trading volume, which determines the reliability of a breakout.
- Apply a strict risk management strategy, especially through setting appropriate stop losses.

When applied correctly, the breakout phenomenon not only helps investors grasp market trends, but also smart investment into projects but also a powerful tool in optimizing trading efficiency.
11. Conclusion
In the field of technical analysis, break out is considered an important phenomenon, helping investors identify new turning points in the stock market. With the ability to detect important price breakthroughs, breakouts not only support trend identification but also open up a series of attractive trading opportunities. However, to fully exploit the potential of this phenomenon, being fully equipped with knowledge and analytical skills is a prerequisite.
To trade effectively based on breakouts, investors need to take advantage of support from technical analysis tools such as RSI, MACD, and Bollinger Bands. These tools not only help assess the reliability of the signal but also play an important role in distinguishing between real and fake breakouts. In which, the factor trading volume is considered a leading indicator, reflecting the strength and durability of a breakout signal.
Not just stop at signal analysis, risk management is also an indispensable part of the breakout trading strategy. Setting reasonable stop loss levels is a way for investors to protect their capital from unexpected risks, especially when encountering inaccurate signals. To ensure safety, waiting for a clear confirmation signal from the market before making a transaction is also a wise and necessary step. Through this article HVA believe that when applied systematically and scientifically, breakout can become a powerful tool, supporting investors not only to optimize profits but also to achieve sustainable success in the stock market. Always remember that knowledge when combined with caution and reasonable strategy will help you maximize the benefits that the breakout phenomenon brings. Therefore, be confident but do not forget to be cautious, turn opportunities into real profits through the effective use of breakout in trading!


