Understand about uptrend and downtrend is the key to smart investment high performance in the stock market. Uptrend indicates an upward trend in stock prices, while downtrend is a downward trend. Recognizing and analyzing these fluctuations helps investors make smart decisions about buying and selling stocks. This may include buying when the stock price is in an uptrend and selling when it reverses to a downtrend. This means optimizing profits and minimizing risks in stock investing.
1. What is Uptrend?
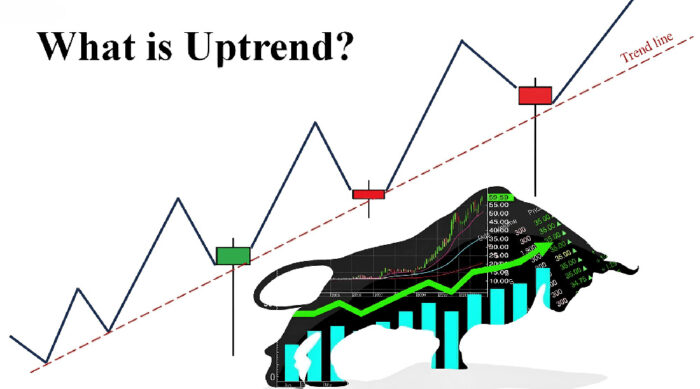
Uptrend, also known as “momentum”, is a common term in the fields of stock trading and technical analysis. It describes an upward trend in the price of a stock or financial asset over a period of time. In an uptrend, prices continue to rise and are usually higher than previous highs, while also higher than previous lows.
>>> See more articles: How to invest money smartly to create sustainable profits
Main features of uptrend market include:
- Increasing prices: This could be due to positive growth in the business, strong financial situation or other factors that create favorable conditions.
- New peaks and troughs: In an uptrend, new peaks and troughs often appear that are higher than the previous levels.
- Support and resistance: In an uptrend, support levels are usually created at higher prices, while resistance levels are usually created at even higher prices.
Mistakes investors should avoid when the market is in a bear market Uptrend phase:
- Not following the market: Ignoring market updates and charts can cause you to miss out on important opportunities to lock in profits. During an Uptrend, rapid price changes can lead to corrections and reversals, so keeping an eye on the market is crucial.
- No investment plan: Lack of a clear investment plan and not setting a profit limit can cause you to lose control in trading. To trade safely during an Uptrend, set specific goals and know when to take profits.
- Borrow more money to invest: Borrowing more money to invest during an Uptrend can be a costly mistake. Instead, manage your finances wisely and use your existing cash to trade safely and cautiously.
The above mistakes can cause serious consequences and lose profit opportunities in the Uptrend market. Therefore, always be careful and patient when participating in stock trading.

2. What is Downtrend?
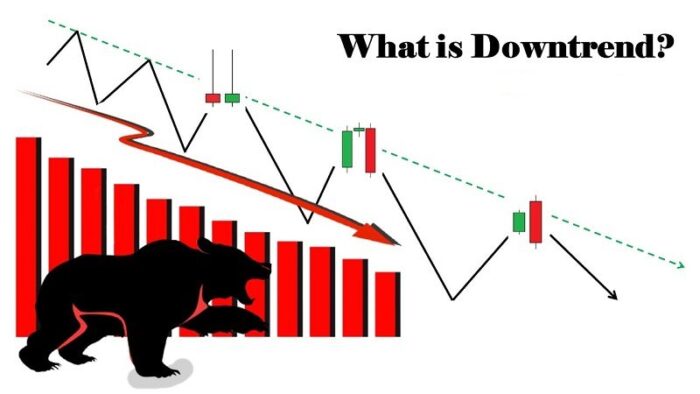
Downtrend, also known as “bearish momentum”, is a term commonly used in stock trading and technical analysis. It describes a downward trend in the price of a stock or financial asset over a period of time. In a downtrend, prices continue to fall and are usually lower than previous lows, but also lower than previous highs.
Main features of downtrend market include:
- Declining prices: This could be due to poor business results, unstable financial situation or other factors that create unfavorable conditions.
- New lows and highs: In a downtrend, new lows and highs often appear that are lower than the previous levels.
- Support and resistance: In a downtrend, support levels usually appear at lower price levels, while resistance levels usually form at even lower price levels.

3. Simple way to recognize Uptrend and Downtrend market
Trendlines
Investors need to use price charts and draw Trendlines to identify the uptrend and downtrend of the market. If the Trendlines connecting the bottoms and tops are trending up, the market is in an uptrend. Conversely, if the Trendlines connecting the bottoms and tops are trending down, the market is in a downtrend.
Trendlines helps investors determine resistance levels, Downtrend/Uptrend time, and market reversal times.
If the slope of the Trendlines is too large, the uptrend may be easily reversed, and the large slope also makes the downtrend easily broken. For accurate forecasting, investors need to use the MA moving average.
The longer a Trendline exists, the more accurate it is and the better it helps investors understand the market trend.
Moving Average MA
Moving Average (MA), also known as moving average, is a popular technical analysis tool in the stock market. MA helps smooth and shrink stock price data, creating a series of continuously updated average values.
Moving averages are determined over a fixed period of time, such as 10 minutes, 20 minutes, or 1 week, depending on the investor's choice. This helps the moving average accurately display market price movements. However, MA often has a certain lag compared to the price. Therefore, investors should combine MA with other indicators to make more accurate judgments.
There are many types of moving averages, such as simple moving average (SMA), linear moving average (EMA), and exponential moving average (WMA). However, SMA and EMA are the two most commonly used.
Signs to identify uptrend and downtrend from the MA moving average usually include:
- If the price crosses above the MA20 line, it may indicate a short-term Uptrend sign.
- When the price crosses the MA50 line, it may indicate a medium-term Uptrend.
- When MA20 crosses MA50, it may indicate a long term Uptrend.
MACD line
MACD stands for Moving Average Convergence Divergence. It is an important technical indicator in technical analysis of stocks, created in 1979 by Gerald Appel, a professional investment advisor.
The MACD indicator helps investors identify uptrend and downtrend market movements, providing buy and sell signals. The MACD line is determined by the difference between two moving averages (EMA) with a period of 12 and 26 days.
How to calculate MACD: MACD = EMA(12) – EMA(26)
If the 12-day EMA is greater than the 26-day EMA, the MACD is positive. If the 12-day EMA is less than the 26-day EMA, the MACD is negative. When the MACD is positive, the shorter EMA is above the longer EMA, and vice versa. There are four components that make up the MACD indicator: the MACD line, the signal line, the histogram, and the zero line.
MACD can be used to identify crossovers, overbought/oversold zones, and divergences. A crossover occurs when the MACD crosses above the signal line, overbought/oversold zone is identified when the MACD widens the gap, and divergence occurs when the MACD is not compatible with the security price. If the MACD line crosses the signal line from bottom to top, it signals a price increase, uptrend market, investors should buy. Conversely, if the MACD line crosses the signal line from top to bottom, signaling a price decrease, investors should consider selling. Note: the MACD line is shown in blue and the signal line is shown in red. This helps investors better understand the development of the market and make decisions. long term investment or surfing more reasonable
Stock price increases/decreases beyond resistance/support level
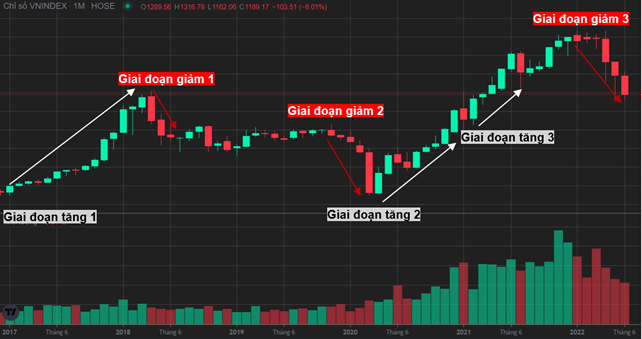
Observing stock prices and stock index of the market such as VN-Index is an important way to recognize uptrend and downtrend signs in the stock market. When the stock price breaks through the resistance level, this can indicate that the market is preparing for an Uptrend cycle. Conversely, when the price falls beyond the support level, it can be a sign that a Downtrend cycle is about to take place.
However, to judge the reliability of these signals, it is important to look at the trading volume. If the breakout occurs with high trading volume, this usually indicates that there is a stronger bearish momentum going on. Meanwhile, if the breakout occurs with low volume, more information may be needed to draw an accurate conclusion about the market trend.

4. Signs of change from Uptrend to Downtrend
Uptrend and Downtrend Phase will end when the following peaks tend to be lower than the previous peaks, the following bottoms are lower than the previous bottoms. When the 2 MA lines are established to intersect, this is very likely to be a reversal point, ending the uptrend period. In addition, the uptrend can end sooner when there are impacts such as financial fluctuations, economic crises, wars, or epidemics.
The downtrend duration depends on many factors related to the general market fluctuations and the individual business performance of the stock. Usually, uptrend and downtrend will end when the difference between the adjacent peaks and troughs becomes increasingly narrow.
The transition is usually gradual and has the following specific characteristics:
- Falling below recent low: A downtrend usually begins when the stock price falls below its most recent low. This is a sign of tension before the market turns.
- Subsequent Peak Not Higher Than Previous Peak: The subsequent peak of price does not exceed the previous peak in an uptrend. This is a sign that buying pressure is decreasing and selling pressure is increasing.
- Increased likelihood of downtrend continuation: When price fails to break above the previous peak and the downtrend continues, there is a high probability that the market is moving from a positive state to a negative state.
- Increase in the number of sellers and decrease in the number of buyers: A trend shift is often accompanied by an increase in the number of sellers and a decrease in the number of buyers. This indicates a change in market sentiment.
- Confirmation and related news: For example, when the price of gold continues to rise, an international economic report on the global recession is released, accompanied by a forecast of a decline in the price of gold. This information stimulates concern, and news articles also begin to publish information about the decline in the price of gold. This confirmation and news prompt investors to want to exit the market, contributing to the transition from an uptrend to a downtrend.

5. Note when the market is uptrend and downtrend
During the Uptrend phase, investor It is important to monitor the market regularly and update information quickly so as not to miss profit-taking opportunities. Set specific goals and determine the profit-taking point before entering the transaction to ensure safety and optimize profits. Owning more stocks during the Uptrend period can help increase profits when the market develops positively. However, it is necessary to consider using reasonable financial leverage to maximize profits without putting yourself in a situation of too high risk.
Meanwhile, when the market moves into a Downtrend phase, investors need to keep a calm mind and avoid panic to make the right decisions during difficult times. Diversifying the investment portfolio and allocating a reasonable proportion of capital to different types of assets helps to minimize risks in difficult market conditions. Moreover, it is important to avoid being caught up in the feeling of FOMO and limit the sell-off according to the general fluctuations of the market, instead, focus on specific investment strategies and important information to achieve the best results.
Source: Onstocks


