
What is MA? This is an important tool in stock trading, helping investors determine the time to trade and optimize profits. In technical analysis, MA lines are commonly used. However, not everyone knows how to understand their nature and how to use them properly.
1. What is MA line in stocks?
The MA line, also known as the Moving Average (MA), is used to show the volatility and trend indication of stock prices over a certain period of time.
What is the main purpose of the MA Line? To track the stability or volatility of a stock price in a downtrend or uptrend. The MA Line is not a forecasting tool, but is often considered a lagging indicator, focusing on price action that has already been established.
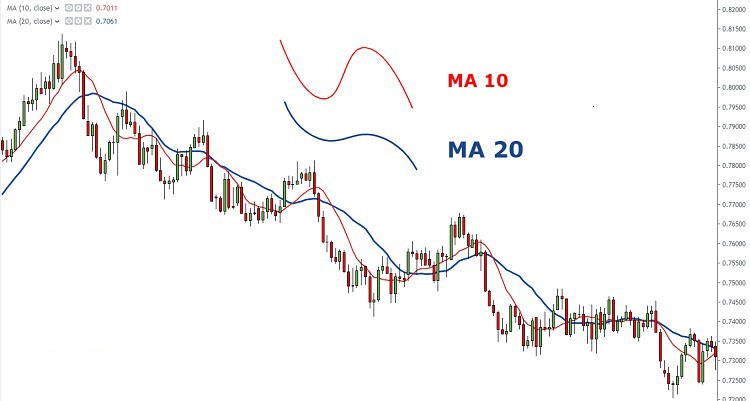
There are three common types of MA Lines: SMA (simple moving average), WMA (linearly weighted moving average), and EMA (exponential moving average). For short-term MA Lines, MA10, MA14, MA20 are commonly used. For medium-term MA Lines, MA50 is commonly used; and For long-term MA Lines, MA100, MA200 are commonly used.
MA lines can be used to determine trade timing, compare market performance, trade with market trends, and identify dynamic resistance/support levels.
2. Meaning of MA line
The MA line plays an important role in technical analysis of stocks with the following specific meanings:
- Filter out noise and highlight trends: The MA line helps filter out the noise in stock price fluctuations, thereby highlighting trends based on average prices. Thanks to this, investors can easily identify and evaluate market trends, thereby making more accurate investment decisions.
- Compare and predict trends: By observing the slope of the MA line, investors can compare the value of stocks between different periods, including in the past. This helps them predict the upward or downward trend of the market, thereby making effective trading decisions.
- The MA line value is the investment expectation: The value of the MA line at a given time represents the investment expectations of investors at that time. If the stock price is higher than the MA line at the time of purchase, this shows that investors have higher expectations for stock price growth, and therefore the market is likely to move in an upward direction.

3. The role of MA line in stock trading
What is MA line and what role does it play in technical analysis of stocks and at the same time carries the following basic rules:
- Smoothness of MA Line: If the MA moves closer to the price line, that is, it follows or moves in the same direction as the price line, the smoother it is and the less likely it is to predict the price trend. Conversely, if the MA moves further away from the price line, the smoother it is and the more difficult it is to determine the price trend.
- MA Line Lag: A short-lag MA will help investors catch price trends in time and identify good entry and exit points. However, it also carries many noise signals. On the contrary, a high-lag MA will make it more difficult to catch price trends, but has fewer noise signals.
- The role of MA as dynamic support and resistance line: In an uptrend, when the stock price corrects and touches the MA, the MA can act as dynamic support. In a downtrend, when the stock price corrects and touches the MA, the MA can act as dynamic resistance. This helps investors identify potential buy and sell points in the market.
4. Popular MA lines
What are the types of MA lines? Currently, there are three popular types of MA lines used in technical analysis of stocks, including: simple moving average, linear weighted moving average and exponential moving average. These three types of MA lines each have their own advantages and applications, depending on the trading strategy and investment style of each investor, they will choose the most suitable MA line.
Simple Moving Average (SMA):
- The MA is a simple average of the closing prices over a given number of days or periods. The SMA is the simplest and easiest to understand of the three types of MAs.
- Calculation formula: SMA = (P1+P2+…+Pn)/n
- Interpreted as: take the sum of prices (closing price, opening price or selected price) over the selected time period (10, 20, 50, 100, 200) and divide by the total number of selected sessions.
- Short term example 20 days SMA 20 = (P1 + P2 + P3 + …..+ P20)/20
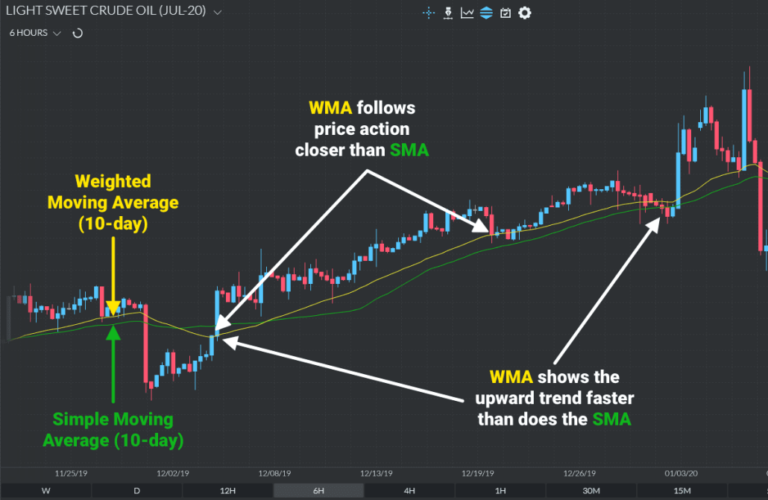
Weighted Moving Average (WMA):
- This is an average MA with weights assigned to more recent values, making it more responsive to the latest market movements.
- Calculation formula: WMA = 2 x [P1 xn + P2 x (n-1) + … + Pn]/ [nx (n + 1)]
- The WMA line focuses on parameters with high frequency of occurrence, meaning that price steps with large trading volume along with the quality of money flow will be focused on.
Exponential Moving Average (EMA):
- It is an exponentially weighted average of more recent values. EMA responds faster and more accurately reflects the latest market movements.
- Calculation formula: EMA = Pt xk + EMay x (1-k)
- Interpreted as follows: Pt: Today's closing price, K is the smoothing factor, calculated as 2/(number of days in EMA period + 1), EMay is the previous EMA value
- The EMA is extremely sensitive to short-term fluctuations because its exponential formula, which is faster than the SMA, helps investors react promptly to short-term price fluctuations.
- To calculate the EMA line, we must first calculate the SMA line, then calculate the multiplier for the smoothing factor, then divide by the previous EMA line weight.
5. Important milestones of the MA line
In technical analysis of stocks, MA (Moving Average) lines play an important role in shaping trends and determining investors' entry points. Important milestones of MA lines are often determined based on popular time, and they help investors better understand the long-term, medium-term and short-term trends of the market.
First of all, with short-term MA, the common time period is usually 10, 14 or 20 days. Short-term MA is often used to assess short-term market volatility. When the stock price crosses the short-term MA from bottom to top, this can be a sign of a new uptrend or a short-term recovery in the current trend. Conversely, if the stock price hits the MA from top to bottom, it can be a signal for further decline or a trend reversal.
Second, with the medium-term MA, the common time period is usually 50 days. The medium-term MA is often used to assess the medium-term trend of the market. When the stock price crosses the medium-term MA from bottom to top, this can indicate a new uptrend is forming or a consolidation in the current uptrend. Conversely, if the stock price crashes into the MA from top to bottom, it can be a sign of weakness or a trend reversal.
Finally, with the long-term MA, the common time period is usually 100 or 200 days. The long-term MA is often used to assess the long-term trend of the market. When the stock price crosses the long-term MA from bottom to top, this can be a sign of a new long-term uptrend or a strong consolidation in the current uptrend. Conversely, if the stock price hits the MA from top to bottom, it can be a sign of a trend reversal or weakness in the market. These are important milestones that help investors better understand the trend and make reasonable trading decisions.
6. How to use MA line to analyze stocks
Moving Average (MA) is a popular tool in technical analysis of stocks, used to determine trading timing and better understand market trends. Here is how to use MA in stock analysis:
- Determine the transaction time:
- When the price crosses above the SMA20, SMA50 or SMA100, it is a bullish signal in the short, medium or long term.
- When the SMA50 line is lower than the SMA20 or when the price line is lower than the SMA20 line, this is a bearish signal in the long term or short term.
- Beneficial market comparison:
- The steeper the MA line, the stronger the trend, creating more profitable trading opportunities.
- If the MA line is horizontal and has a small slope, the market trend is weak and trading opportunities are reduced.
- Trade with market trends:
- In an uptrend, the price will be above the MA line, which means buying is appropriate.
- In a downtrend, the price will be below the MA line, which means selling is the option.
Grasping and understanding these principles will help investors make accurate trading decisions and optimize profits in the stock market.
Source: Onstocks