
What is MACD line? It is a popular technical indicator in stock analysis that measures the difference between two moving averages, usually 12 and 26 days. The indicator provides buy and sell signals based on the crossover between the MACD line and the signal line. It can also reflect divergence or convergence between the MACD line and the price chart, helping investors make smart trading decisions in the market.
What is MACD line?
MACD line (Moving Average Convergence Divergence) is one of the popular and widely used technical indicators in stock analysis to reflect market volatility and provide buy and sell signals. Invented by investor Gerald Appel in 1979, MACD is also known as moving average convergence divergence.
The calculation of MACD is the difference between the 12-day moving average (EMA) and the 26-day moving average.
MACD = EMA (12) – EMA (26)
In MACD line technical analysis can be determined by the difference between the 12-day moving average (EMA) and the 26-day EMA. If the 12-day EMA value is greater than the 26-day EMA, the MACD will be positive and vice versa, if the 12-day EMA is less than the 26-day EMA, the MACD will be negative.
Next to MACD line, there is also a signal line, which is the 9-day EMA of the MACD. When the MACD line crosses the signal line from bottom to top, it is a buy signal and vice versa, when the MACD crosses the signal line from top to bottom, it is a sell signal.
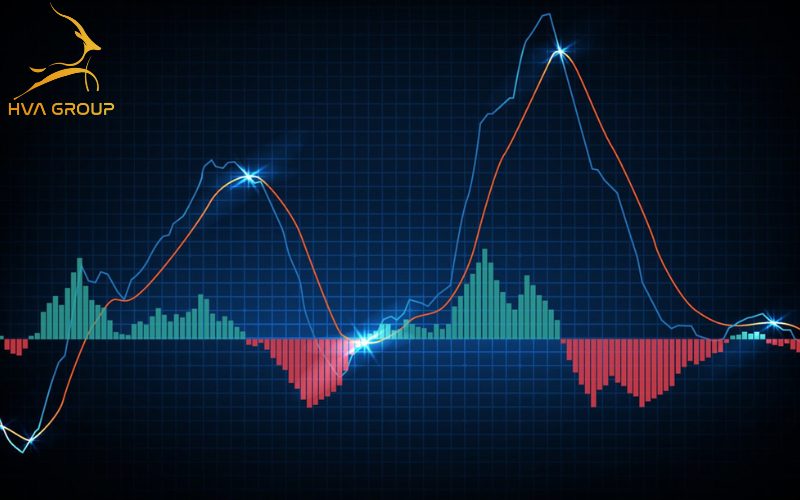
Normally, the MACD line is shown in green and the signal line is shown in red.

MACD line (blue) goes below signal line (red)
MACD chart It can also provide signals through divergence or convergence between the MACD line and the price action of the stock.
Usually, when the stock price increases, the MACD line also increases and vice versa. However, this is not always the case. In the case of divergence, that is, when the stock price increases but the MACD line decreases, the two lines move away from each other as shown in the chart below.

Price trend and MACD line create divergence
This warns that the stock is likely to reverse from bullish to bearish, investors should consider selling the stock when the divergence occurs.
Conversely, if the stock price goes down but the MACD line goes up, the two blue lines move in close directions, this is called convergence.
Price trend and MACD line create convergence
Signal when MACD line intersects signal line Often considered a sign of a reversal from a downtrend to an uptrend, this is when investors may consider buying the stock.
However, like any other technical indicator, MACD MACD is also not perfect and can give inaccurate and misleading signals. To use MACD effectively, investors need to be flexible and updated with the market, as well as understand the appropriate time to apply this indicator. Moreover, combining MACD with other technical indicator Other can help reduce risk and confirm trading signals.
2. Identify the MACD line on the stock chart
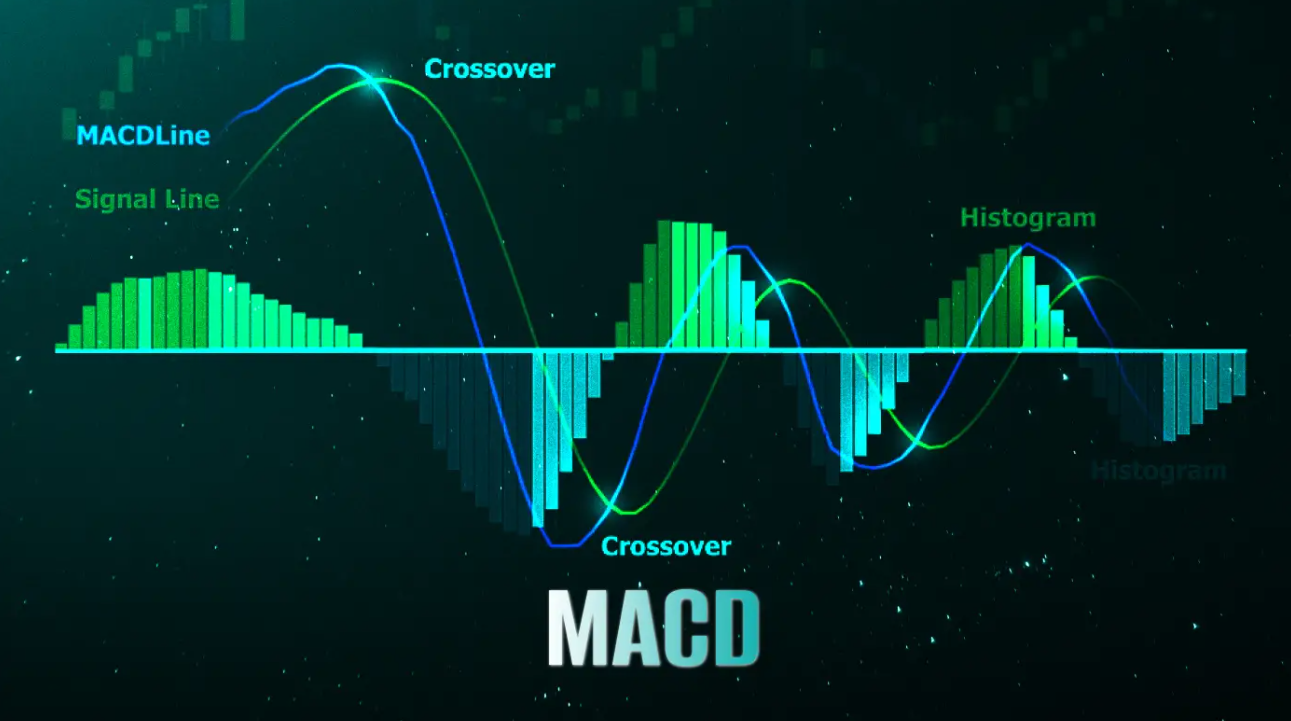
The easiest way to know MACD line in stocks is through color: the MACD line is shown in blue, and the signal line is red.
When the MACD is positive, the shorter EMA is above the longer EMA. The larger the difference between the two EMAs, the more positive the MACD is, indicating a potential increase in the market's value.
>>> See more articles: Mistakes in allocating money for stock investment
Conversely, when the MACD is negative, the shorter EMA will be below the longer EMA. The wider the gap between the two EMAs, the more negative the MACD will be, which is a sign of a clear downtrend coming.
The relationship between EMA lines can show either divergence or convergence. When the two lines move away from each other, it is divergence; when they move closer together, it is convergence.

3. How to use MACD line in stock trading
The MACD line is a popular tool in stock analysis and can be used in a variety of ways, including:
- Intersection: The basic use of MACD is when the MACD line crosses above or below the signal line. This crossover usually generates a buy or sell signal, respectively.
- Overbought/Oversold Zone: MACD provides an overbought or oversold signal when the shorter moving average widens the gap with the longer moving average. This usually occurs when the MACD spikes, indicating that the stock price may soon correct back to reasonable levels.
- Divergence: Divergence occurs when the current trend in a security's price is about to end and may reverse. A bearish divergence occurs when the MACD makes a new low and the security's price does not. A bullish divergence occurs when the MACD makes a new high and the price does not. Both types of divergence provide strong signals when they occur in overbought or oversold areas.
By using the methods technical analysis This way, investors can effectively leverage the power of MACD indicator to make smart trading decisions in the stock market.
Source: Onstocks