
What is ADX indicator? Is an analytical tool that helps determine the strength of market trends, supporting investors in making accurate trading decisions in stocks.
What is ADX Indicator?
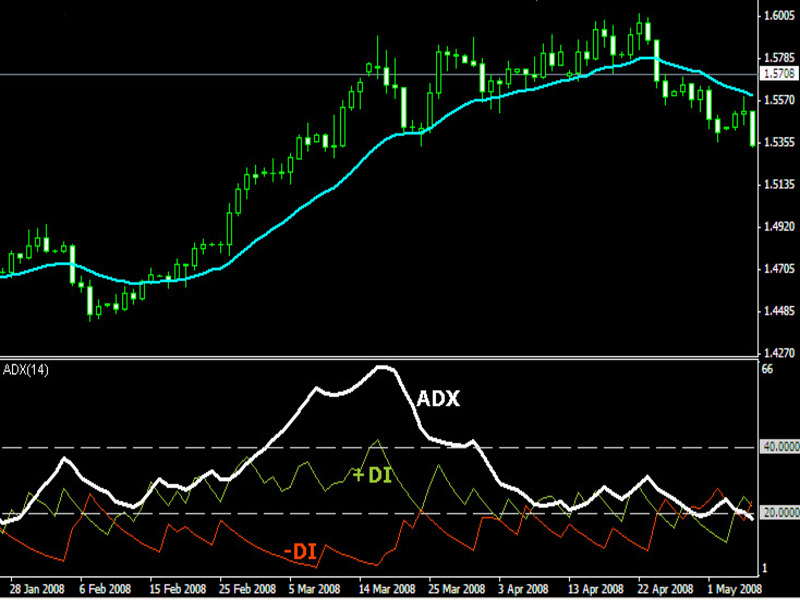
What is ADX indicator? ADX, which stands for Average Directional Index, is a technical indicator developed by J. Welles Wilder in 1978. The main purpose of the ADX indicator is to measure the strength of a trend in the market. However, the ADX indicator does not provide information about the direction of the trend (up or down), but only shows whether the trend is strong or weak.
The ADX indicator is calculated from two secondary indicators, +DI (Positive Directional Indicator) and -DI (Negative Directional Indicator). +DI represents an uptrend while -DI represents a downtrend. The ADX indicator indicates the strength of a trend without indicating whether the trend is up or down.
What is ADX indicator? It is an analytical tool that helps investors identify the strength of market trends. The value of ADX ranges from 0 to 100, and the way to read this indicator is as follows:
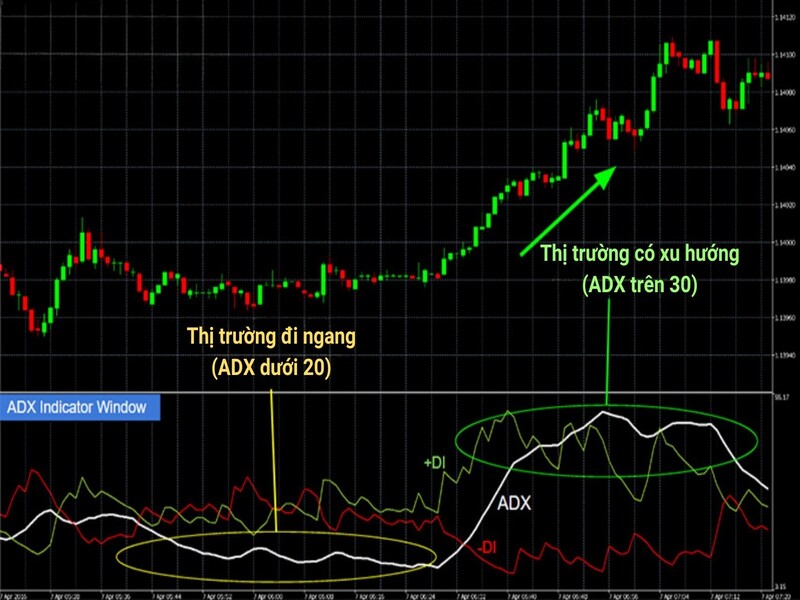
- ADX below 20: The market has no strong trend or weak trend.
- ADX from 20 to 40: The market is trending moderately.
- ADX above 40: The market tends to be strong and can last.
ADX indicator is one of the investment knowledge important for investors to grasp, it helps investors assess the strength of the trend and decide to participate in transactions at the right time.

What is ADX Index?
What is adx indicator?The ADX (Average Directional Index) is a popular technical indicator in analysis. financial market. It is used to measure the strength of a trend in the market. The ADX indicator is calculated based on the difference between the +DI and -DI indicators over a specific period of time (usually 14 trading periods). Investors use the ADX indicator to assess whether the market is in a clear trend, and how strong that trend is.
How to read ADX indicator:
- ADX < 20: The market has no clear trend or a weak trend, often fluctuating sideways.
- ADX from 20 to 25: The trend begins to form, there is a clearer movement.
- ADX > 25: Strong trend, suitable for trend trading.
Understanding and applying the ADX indicator in trading helps investors make accurate decisions, especially when combined with other indicators to optimize trading strategies.
ADX Index In Stocks
ADX index in stocks used to measure the strength of trends in the stock market. For investors, understanding ADX index in stocks is extremely important to assess the stability of a trend. When ADX index in stocks high, the market may be in a strong trend, and trading decisions following this trend can be highly profitable. Conversely, when ADX indicator low value, the market may be sideways or without a clear trend.
To better understand how to use ADX index in stocks, you need to combine it with other indicators like +DI and -DI. When +DI crosses -DI and ADX rises, it is a sign that the uptrend is strong. Conversely, if -DI crosses +DI, then a downtrend may be forming. Additionally, when ADX index in stocks crosses 40, this shows that the market is in a very strong trend and you can follow this trend to gain profit.
How to Use ADX Indicator Effectively
When using the ADX indicator It is not enough to simply look at the value of ADX but also to understand how to combine this indicator with other analytical tools to make accurate trading decisions. Here are some How to use ADX indicator effectively in transaction:
- Determine the strength of the trend: When the ADX indicator is above 20 and continuously increasing, this shows that the market is in a strong trend. If the ADX indicator goes above 40, this is a sign that the market is in a very strong trend. You can then trade in that trend.
- Combining ADX with +DI and -DI: To better understand the trend, you can combine the ADX indicator with the +DI and -DI indicators. When +DI crosses -DI and ADX is greater than 20, you can enter a buy order, and when -DI crosses +DI, you can enter a sell order.
- Avoid trading when ADX is low: When ADX indicator in stocks Below 20, the market has no clear trend and may be sideways or fluctuating weakly. In this situation, you should avoid trading or look for other signals.
- Confirm entry and exit points: Using the ADX indicator not only helps to identify trends but also helps to determine entry and exit points. When the ADX is above 20 and there is a clear difference between +DI and -DI, you can decide to enter a buy or sell order depending on the market situation.
How to View ADX Indicator in Stock Trading
How to view ADX indicator in stock trading is simple but effective if you apply the right method. Here are the basic steps to use the ADX indicator in stock trading:
- Add ADX indicator to chart: On trading software like MetaTrader 4 (MT4) or MetaTrader 5 (MT5), you can easily add the ADX indicator to the chart to analyze market trends.
- Read ADX signals: When the ADX indicator is above 20 and +DI crosses -DI, you can enter a buy order if the market is in a strong uptrend. If -DI crosses +DI, it is a sign that the market is falling and you can enter a sell order.
- Combining ADX with other indicators: To achieve optimal efficiency, you should combine the ADX indicator with other indicators such as RSI, MACD, or moving averages to confirm signals and make accurate trading decisions.
Benefits and Limitations of ADX Indicator
Benefit:
- The ADX indicator helps investors determine the strength of the trend, thereby identifying the time when the market has a clear and strong trend. This is important because when the market has a strong trend, trading in the direction of the trend will have a higher success rate.
- When combined with other indicators such as +DI and -DI, the ADX indicator provides more accurate signals on when to enter and exit orders. This helps investors have better trading strategies, minimize risks and optimize profits.
- The ADX indicator is easy to use and understand, helping investors quickly identify market trends without having to understand other complex indicators in depth. This is a great tool for both beginners and experienced traders.
Limit:
- The ADX indicator only helps determine the strength of the trend without indicating the direction of the market (up or down). Therefore, if used alone, this indicator is not enough to accurately determine the trend, and you need to combine it with other tools to have full information.
- For optimal results in trading, the ADX indicator should be combined with other indicators such as RSI, MACD or moving averages to confirm signals and avoid wrong decisions. Using the ADX alone can lead to inaccurate analysis.

Conclude
What is ADX indicator? It is a powerful tool that helps investors assess the strength of market trends, thereby making accurate trading decisions. Understanding ADX index in stocks and know How to use ADX indicator effectively will help you improve your analytical skills and optimize your trading profits.
HVA Group Hope the information provided will help you understand. How to use ADX indicator with other technical analysis tools to have an effective and successful trading strategy in this volatile market.