
Technical analysis of stocks is an important factor for investors to make accurate decisions in the market. So how to do technical analysis of stocks What is that?
What is technical analysis of stocks?
Can say technical analysis of stocks is a prediction of how prices will move in the future based on past price observations.
Technical analysis has a very broad application in stocks, commodities, indices, and tradable futures where prices are influenced by supply and demand forces. And price refers to the relationship between the high, low, open, and close of a security over different time frames.

Technical analysis does not consider the value of a stock as the primary motive for buying or selling stocks, but rather requires the study of trends and dynamics in the price and volume of a stock.
Based on current market trends, traders can still decide when to buy and when to sell stocks. Technical analysts will mainly use charts and will not often consult opinions about the financial situation of the company.
Fundamental analysis is used to evaluate a stock based on the company's financial performance. technical analysis of stocks aimed at studying stock prices as well as trading volumes. And this analysis will also include tools to be able to assess the effects of supply and demand on a stock will affect how, how to affect the price of that stock. And this is usually only used in short-term investment work.
Advantages and disadvantages of technical analysis of stocks
What are the advantages of technical analysis of stocks?
- Firstly, the most obvious advantage is that technical analysis with a high accuracy rate is the way for investors to easily determine trading times such as cutting losses, entering orders or taking profits, for example. Indicators as well as models built by truly professional investors and experts with a lot of experience are also what will help new investors to use the method to set up trading orders more accurately and appropriately.
- Price action will often precede fundamental analysis. By focusing on price action, technical analysts can also predict what the future will hold.
- Simple chart analysis can also help identify support and resistance levels. These are often marked by periods of congestion or trading ranges and prices moving within a narrow range for an extended period of time will also indicate that supply and demand have become stagnant.
What are the disadvantages of technical analysis of stocks?
- One thing that investors need to acknowledge is that not every signal or technical model works absolutely correctly. And when starting to study technical analysis, you will certainly encounter a series of models as well as indicators with rules to combine.
- The reality is that the Vietnamese stock market is full of fluctuations and will likely cause a lot of risks because the results are likely to be slower than reality. And of course this option will be criticized by investors because the profit: loss ratio is no longer as attractive as before. At the time this trend is determined, the market has moved significantly. After such a big move, the profit: loss ratio will no longer be as large as before.
- Despite the standards, many times two technical analysts looking at the same chart will end up with two different scenarios. And both will be able to come up with reasonable support levels as well as key resistance levels to justify their analysis.
The role of technical analysis of stocks
It can be said that technical analysis plays a very important role, it will include three main functions: alerting, validating and making predictions.
- Alarm tool: This analysis will give warnings of support and resistance breaks, and it can also establish new safety levels instead of continuing to fluctuate around the same old price level. Investors can also recognize changes in price levels as early as possible, so they can make more accurate buying or selling actions.
- Validation tool: These analysis methods can also be used in combination with other methods to determine price trends. Using different technical methods is also a way to help investors make quick and accurate decisions.
- Prediction tool: Investors will use the conclusions of the above method to make predictions about future price changes. Thanks to these methods, investors can also reduce the possibility of making wrong predictions due to lack of information or being affected by crowd effects.
Effective stock technical analysis tools
And the set stock technical analysis tools Introduced today is the investment support toolkit researched and developed by Take Profit.
And the investment support toolkit will include the following tools:
- Tools to determine stock strength from sector to stock: This is an effective tool and helps investors measure the strength of stocks as well as industries compared to the VN-Index.
- Cash flow tool: This tool is based on active matching orders during the session and is integrated from different perspectives such as cash flow by market capitalization group, cash flow by industry and cash flow by stock.
- Market sentiment determination tool: It can be said that market sentiment is a tool with stock market sentiment indicator that will include optimistic and pessimistic sentiment and will go from levels from 0 to 100.
Guide to technical analysis of stocks through charts
And if you are a new investor and do not know much about how to read charts and indicators, you can refer to and learn more to be able to grasp more. investment knowledge for myself
Technical analysis of stocks will often be based on graphs or charts to be able to give the most appropriate times to buy or sell stocks. And let's learn about the stock technical analysis guide through charts as well as investing in yourself the Technical analysis of stocks in the most understandable and effective way.
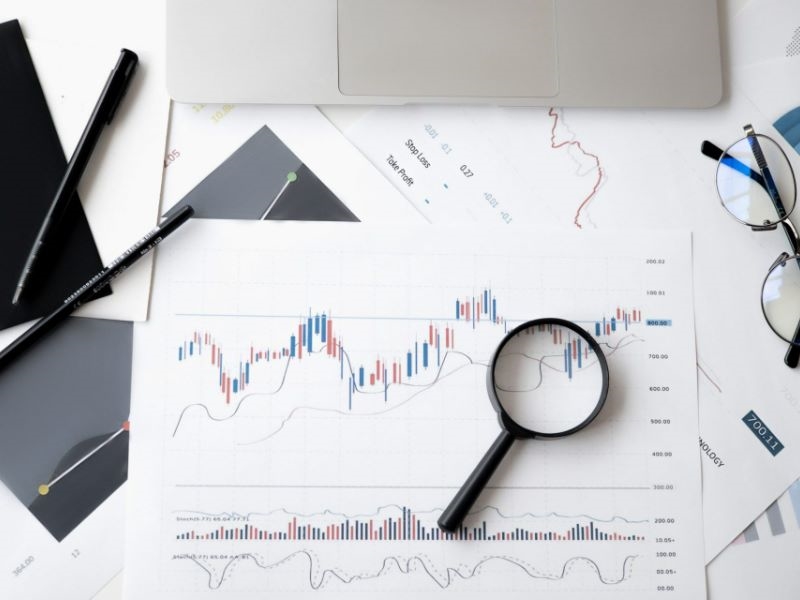
There are usually three types of charts that are often encountered when analyzing technical stocks: candlestick charts, line charts, and bar charts. And specifically, the characteristics of each type of chart are:
- Candlestick chart: This is a type of online technical analysis chart and it is formed by two main axes which are the vertical axis containing information and the horizontal axis containing time information.
- Line chart: This type of chart represents the closing price of the trading session in a single line and this chart is most suitable for long-term analysis.
- Formation chart: This chart type will provide opening, closing, floor and ceiling price indicators.
First, you need to understand the general interface of the chart, which will be divided into 1 vertical axis and 1 horizontal axis. They will be divided into areas such as: Tool area, price fluctuation area, trading volume area and drawing tool area.
- Price fluctuation zone: Price fluctuations will be displayed in the form of candlestick charts and the price of each day is 1 candle. The longer the candle, the greater the price fluctuation between the opening and closing prices. If a line appears on the candle body, it represents the highest price of the session, growing below represents the lowest price of the session. The color of the candle is red and green: red means that the price that day is lower than the opening price, green is the opposite.
- Trading volume zone: Trading volume will show whether there are many people buying and selling stocks or not, thereby being able to grasp the psychology of other investors.
- Drawing tool area: This drawing tool will be located along the left side of the screen and it includes many items for investors to analyze more effectively, some items such as line drawing tool group, model drawing tool group.
In short technical analysis of stocks plays a very important role in whether investors decide to buy or sell stocks. Hopefully, the information that HVA Group provided above will help you answer all your questions as well as serve your investment more effectively.